Why is Phoenix Project using 100% CPU of Digital Ocean droplet?

I am running a fairly simple Phoenix app on a Digital Ocean 5$ droplet (SGP1, 1GB memory, 25GB disk). The app calls around 5 APIs, and stores it in 5 postgres tables every 2 minutes. Usually there are 50-100 rows in each table. The views then display the data on different pages. I am the only user of the app. Usually the CPU load is 1% but today I noticed that it has been 100% since the last few days. On running HTOP, I noticed 2 postgres processes taking up 100% CPU. Below are couple of snapshots.


Any addvice ?

1 Like

so this is the question why postgresql is taking 100% CPU. And this can be a question of ur queries, that are running, maybe they are super slow and inefficient. And maybe this is a question of PostgreSQL configuration. It’s probably the first and you should look into why your queries are so slow, but in case you need to do some minor tweaks that can have huge effect, I wrote a blog post years ago how to tweak some variables:

that I believe is still mostly up-to-date.

Hey @theagilecoder this is a good summary of what you’re observing, but we need a lot more information about your application to be of any help. Can you provide logs from your elixir server? Try turning on debug level logging to record what database queries are running.

We also need information about the database. How large are the tables? What are their schemas? Run something like:

SELECT pid, age(clock_timestamp(), query_start), usename, query 
FROM pg_stat_activity 
WHERE query != '<IDLE>' AND query NOT ILIKE '%pg_stat_activity%' 
ORDER BY query_start desc;

in psql to see what queries are being run.

2 Likes

My queries are just simple and parallel upserts. This is a typical upsert for a table.

def upsert_coinbase_portfolio() do
    Coinbase.fetch_portfolio()
    |> Task.async_stream(&Repo.insert(&1,
        on_conflict: {:replace, [:price_usd, :price_inr, :price_btc, :updated_at]},
        conflict_target: [:coin, :quote_currency]))
  end

As mentioned in post, all tabes are not more than 100 rows with 5-10 columns.

The whole scenario here is that what is actually happening is different than what you expect. Code is helpful, but what we need are logs and psql based inspection of what’s actually happening in postgres.

1 Like

This is the result I got when i ran your query in psql

If you don’t mind copying and pasting that as text next time it’ll make it a lot easier to work with.

If you run the query again, what output do you get? It sorta looks like it’s taking well over a minute to insert values into that table.

What do you get if you ru

select count(*) from dashboards;
\d dashboards

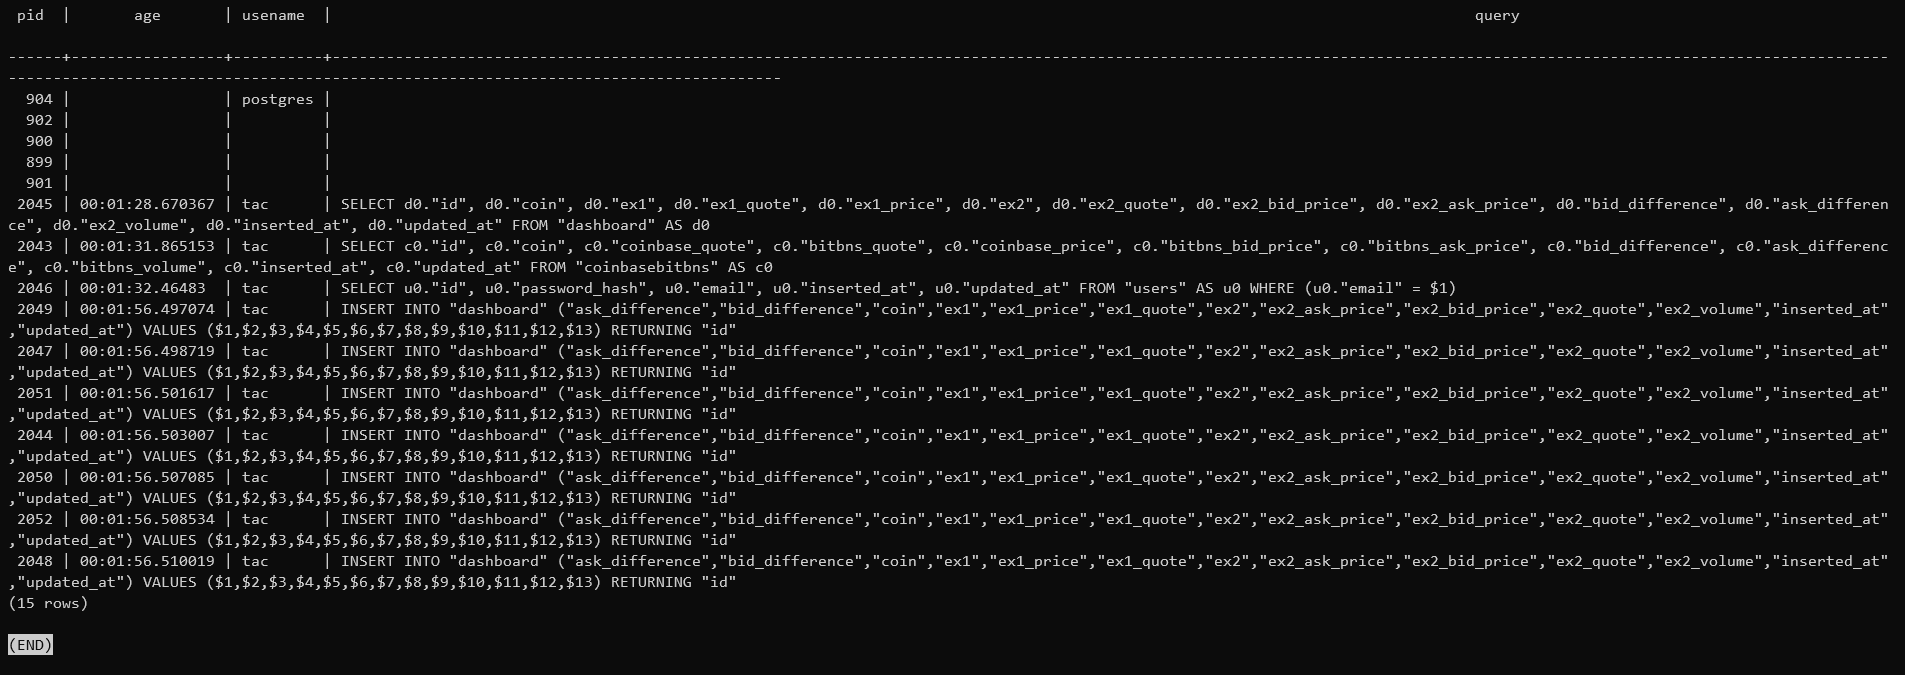
When I ran your first query again , this is what I got

 pid  |       age       | usename  |                                                                                                                             query

------+-----------------+----------+---------------------------------------------------------------------------------------------------------------------------------------------------------------------------------------------------------------------------------------------------------------
  904 |                 | postgres |
  902 |                 |          |
  900 |                 |          |
  899 |                 |          |
  901 |                 |          |
 2045 | 00:01:17.312173 | tac      | INSERT INTO "dashboard" ("ask_difference","bid_difference","coin","ex1","ex1_price","ex1_quote","ex2","ex2_ask_price","ex2_bid_price","ex2_quote","ex2_volume","inserted_at","updated_at") VALUES ($1,$2,$3,$4,$5,$6,$7,$8,$9,$10,$11,$12,$13) RETURNING "id"
 2051 | 00:01:17.31781  | tac      | INSERT INTO "dashboard" ("ask_difference","bid_difference","coin","ex1","ex1_price","ex1_quote","ex2","ex2_ask_price","ex2_bid_price","ex2_quote","ex2_volume","inserted_at","updated_at") VALUES ($1,$2,$3,$4,$5,$6,$7,$8,$9,$10,$11,$12,$13) RETURNING "id"
 2044 | 00:01:17.320046 | tac      | INSERT INTO "dashboard" ("ask_difference","bid_difference","coin","ex1","ex1_price","ex1_quote","ex2","ex2_ask_price","ex2_bid_price","ex2_quote","ex2_volume","inserted_at","updated_at") VALUES ($1,$2,$3,$4,$5,$6,$7,$8,$9,$10,$11,$12,$13) RETURNING "id"
 2043 | 00:01:17.32178  | tac      | INSERT INTO "dashboard" ("ask_difference","bid_difference","coin","ex1","ex1_price","ex1_quote","ex2","ex2_ask_price","ex2_bid_price","ex2_quote","ex2_volume","inserted_at","updated_at") VALUES ($1,$2,$3,$4,$5,$6,$7,$8,$9,$10,$11,$12,$13) RETURNING "id"
 2046 | 00:01:17.323328 | tac      | INSERT INTO "dashboard" ("ask_difference","bid_difference","coin","ex1","ex1_price","ex1_quote","ex2","ex2_ask_price","ex2_bid_price","ex2_quote","ex2_volume","inserted_at","updated_at") VALUES ($1,$2,$3,$4,$5,$6,$7,$8,$9,$10,$11,$12,$13) RETURNING "id"
 2050 | 00:01:17.325368 | tac      | INSERT INTO "dashboard" ("ask_difference","bid_difference","coin","ex1","ex1_price","ex1_quote","ex2","ex2_ask_price","ex2_bid_price","ex2_quote","ex2_volume","inserted_at","updated_at") VALUES ($1,$2,$3,$4,$5,$6,$7,$8,$9,$10,$11,$12,$13) RETURNING "id"
 2052 | 00:01:17.326945 | tac      | INSERT INTO "dashboard" ("ask_difference","bid_difference","coin","ex1","ex1_price","ex1_quote","ex2","ex2_ask_price","ex2_bid_price","ex2_quote","ex2_volume","inserted_at","updated_at") VALUES ($1,$2,$3,$4,$5,$6,$7,$8,$9,$10,$11,$12,$13) RETURNING "id"
 2048 | 00:01:17.328818 | tac      | INSERT INTO "dashboard" ("ask_difference","bid_difference","coin","ex1","ex1_price","ex1_quote","ex2","ex2_ask_price","ex2_bid_price","ex2_quote","ex2_volume","inserted_at","updated_at") VALUES ($1,$2,$3,$4,$5,$6,$7,$8,$9,$10,$11,$12,$13) RETURNING "id"
 2049 | 00:01:17.330681 | tac      | INSERT INTO "dashboard" ("ask_difference","bid_difference","coin","ex1","ex1_price","ex1_quote","ex2","ex2_ask_price","ex2_bid_price","ex2_quote","ex2_volume","inserted_at","updated_at") VALUES ($1,$2,$3,$4,$5,$6,$7,$8,$9,$10,$11,$12,$13) RETURNING "id"
 2047 | 00:01:17.336001 | tac      | INSERT INTO "dashboard" ("ask_difference","bid_difference","coin","ex1","ex1_price","ex1_quote","ex2","ex2_ask_price","ex2_bid_price","ex2_quote","ex2_volume","inserted_at","updated_at") VALUES ($1,$2,$3,$4,$5,$6,$7,$8,$9,$10,$11,$12,$13) RETURNING "id"
(15 rows)

On running select count(*) from dashboards or select count(*) from dashboard, I am getting Did not find any relation named "dashboard". which is trnage because I have the table dashboard.

Did you psql into the correct database? What command did you run for PSQL access?
\l should list available databases.

It’s also quite suspicious that all those INSERT take exactly the same (long) time: 1 minute and 17 seconds (1 minute 56 seconds in your previous screenshot).

Sorry, I am so bad at psql. Yes , I did not enter the correct database earlier. i am so sorry. I ran both of your commands again.

 pid  |       age       | usename  |                                                                                                                             query

------+-----------------+----------+---------------------------------------------------------------------------------------------------------------------------------------------------------------------------------------------------------------------------------------------------------------
  904 |                 | postgres |
  902 |                 |          |
  900 |                 |          |
  899 |                 |          |
  901 |                 |          |
 2049 | 00:01:38.899055 | tac      | INSERT INTO "dashboard" ("ask_difference","bid_difference","coin","ex1","ex1_price","ex1_quote","ex2","ex2_ask_price","ex2_bid_price","ex2_quote","ex2_volume","inserted_at","updated_at") VALUES ($1,$2,$3,$4,$5,$6,$7,$8,$9,$10,$11,$12,$13) RETURNING "id"
 2047 | 00:01:38.900547 | tac      | INSERT INTO "dashboard" ("ask_difference","bid_difference","coin","ex1","ex1_price","ex1_quote","ex2","ex2_ask_price","ex2_bid_price","ex2_quote","ex2_volume","inserted_at","updated_at") VALUES ($1,$2,$3,$4,$5,$6,$7,$8,$9,$10,$11,$12,$13) RETURNING "id"
 2045 | 00:01:38.901886 | tac      | INSERT INTO "dashboard" ("ask_difference","bid_difference","coin","ex1","ex1_price","ex1_quote","ex2","ex2_ask_price","ex2_bid_price","ex2_quote","ex2_volume","inserted_at","updated_at") VALUES ($1,$2,$3,$4,$5,$6,$7,$8,$9,$10,$11,$12,$13) RETURNING "id"
 2051 | 00:01:38.903213 | tac      | INSERT INTO "dashboard" ("ask_difference","bid_difference","coin","ex1","ex1_price","ex1_quote","ex2","ex2_ask_price","ex2_bid_price","ex2_quote","ex2_volume","inserted_at","updated_at") VALUES ($1,$2,$3,$4,$5,$6,$7,$8,$9,$10,$11,$12,$13) RETURNING "id"
 2044 | 00:01:38.905283 | tac      | INSERT INTO "dashboard" ("ask_difference","bid_difference","coin","ex1","ex1_price","ex1_quote","ex2","ex2_ask_price","ex2_bid_price","ex2_quote","ex2_volume","inserted_at","updated_at") VALUES ($1,$2,$3,$4,$5,$6,$7,$8,$9,$10,$11,$12,$13) RETURNING "id"
 2043 | 00:01:38.906622 | tac      | INSERT INTO "dashboard" ("ask_difference","bid_difference","coin","ex1","ex1_price","ex1_quote","ex2","ex2_ask_price","ex2_bid_price","ex2_quote","ex2_volume","inserted_at","updated_at") VALUES ($1,$2,$3,$4,$5,$6,$7,$8,$9,$10,$11,$12,$13) RETURNING "id"
 2046 | 00:01:38.907947 | tac      | INSERT INTO "dashboard" ("ask_difference","bid_difference","coin","ex1","ex1_price","ex1_quote","ex2","ex2_ask_price","ex2_bid_price","ex2_quote","ex2_volume","inserted_at","updated_at") VALUES ($1,$2,$3,$4,$5,$6,$7,$8,$9,$10,$11,$12,$13) RETURNING "id"
 2050 | 00:01:38.909524 | tac      | INSERT INTO "dashboard" ("ask_difference","bid_difference","coin","ex1","ex1_price","ex1_quote","ex2","ex2_ask_price","ex2_bid_price","ex2_quote","ex2_volume","inserted_at","updated_at") VALUES ($1,$2,$3,$4,$5,$6,$7,$8,$9,$10,$11,$12,$13) RETURNING "id"
 2052 | 00:01:38.910679 | tac      | INSERT INTO "dashboard" ("ask_difference","bid_difference","coin","ex1","ex1_price","ex1_quote","ex2","ex2_ask_price","ex2_bid_price","ex2_quote","ex2_volume","inserted_at","updated_at") VALUES ($1,$2,$3,$4,$5,$6,$7,$8,$9,$10,$11,$12,$13) RETURNING "id"
 2048 | 00:01:38.912618 | tac      | INSERT INTO "dashboard" ("ask_difference","bid_difference","coin","ex1","ex1_price","ex1_quote","ex2","ex2_ask_price","ex2_bid_price","ex2_quote","ex2_volume","inserted_at","updated_at") VALUES ($1,$2,$3,$4,$5,$6,$7,$8,$9,$10,$11,$12,$13) RETURNING "id"
(15 rows)

and

arbit_prod=# select count(*) from dashboard;
 count
-------
    78
(1 row)

This is my code for dealing with the dashboard table

 @doc """
  Inserts in dashboard table
  """
  def insert_dashboard do
    # Delete all records from dashboard table
    Repo.delete_all(Dashboard)

    # Parallely insert all results in dashboard table
    Dashboard.collect_all_results()
    |> Task.async_stream(&Repo.insert(&1))
    |> Enum.map(fn {:ok, result} -> result end)
  end

Every 2 mins I delete all from dashbaord table and insert new rows it.

Any indication of code or configuration changes that got deployed when the high CPU utilization started?

As far as I can see, it started around 7 days ago, but I have not pushed anythng since 1 month.
Just sometimes I restart the app because it crashes because i dont have good enough code that can handle error coming in the apis I call, but that happens rarerly.

These inserts happen in milliseconds in dev and I have the same amount of data in dev as in prod. Why is it taking 1 minute + ? That is so strange ? Should I use insert_all instead of parallel insert ?

I restarted my app, now I am getting these numbers

 pid  |       age       | usename  |                                                                                                                             query

------+-----------------+----------+---------------------------------------------------------------------------------------------------------------------------------------------------------------------------------------------------------------------------------------------------------------
  904 |                 | postgres |
  902 |                 |          |
  900 |                 |          |
  899 |                 |          |
  901 |                 |          |
 2046 | 00:00:07.643904 | tac      | SELECT c0."id", c0."amount", c0."pair", c0."inserted_at", c0."updated_at" FROM "currencies" AS c0 WHERE (c0."pair" = $1)
 2050 | 00:00:07.64654  | tac      | INSERT INTO "currencies" ("amount","pair","inserted_at","updated_at") VALUES ($1,$2,$3,$4) ON CONFLICT ("pair") DO UPDATE SET "amount" = EXCLUDED."amount","updated_at" = EXCLUDED."updated_at" RETURNING "id"
 2052 | 00:02:37.732986 | tac      | INSERT INTO "dashboard" ("ask_difference","bid_difference","coin","ex1","ex1_price","ex1_quote","ex2","ex2_ask_price","ex2_bid_price","ex2_quote","ex2_volume","inserted_at","updated_at") VALUES ($1,$2,$3,$4,$5,$6,$7,$8,$9,$10,$11,$12,$13) RETURNING "id"
 2048 | 00:02:37.735065 | tac      | INSERT INTO "dashboard" ("ask_difference","bid_difference","coin","ex1","ex1_price","ex1_quote","ex2","ex2_ask_price","ex2_bid_price","ex2_quote","ex2_volume","inserted_at","updated_at") VALUES ($1,$2,$3,$4,$5,$6,$7,$8,$9,$10,$11,$12,$13) RETURNING "id"
 2049 | 00:02:37.736487 | tac      | INSERT INTO "dashboard" ("ask_difference","bid_difference","coin","ex1","ex1_price","ex1_quote","ex2","ex2_ask_price","ex2_bid_price","ex2_quote","ex2_volume","inserted_at","updated_at") VALUES ($1,$2,$3,$4,$5,$6,$7,$8,$9,$10,$11,$12,$13) RETURNING "id"
 2047 | 00:02:37.738414 | tac      | INSERT INTO "dashboard" ("ask_difference","bid_difference","coin","ex1","ex1_price","ex1_quote","ex2","ex2_ask_price","ex2_bid_price","ex2_quote","ex2_volume","inserted_at","updated_at") VALUES ($1,$2,$3,$4,$5,$6,$7,$8,$9,$10,$11,$12,$13) RETURNING "id"
 2045 | 00:02:37.740348 | tac      | INSERT INTO "dashboard" ("ask_difference","bid_difference","coin","ex1","ex1_price","ex1_quote","ex2","ex2_ask_price","ex2_bid_price","ex2_quote","ex2_volume","inserted_at","updated_at") VALUES ($1,$2,$3,$4,$5,$6,$7,$8,$9,$10,$11,$12,$13) RETURNING "id"
 2051 | 00:02:37.741649 | tac      | INSERT INTO "dashboard" ("ask_difference","bid_difference","coin","ex1","ex1_price","ex1_quote","ex2","ex2_ask_price","ex2_bid_price","ex2_quote","ex2_volume","inserted_at","updated_at") VALUES ($1,$2,$3,$4,$5,$6,$7,$8,$9,$10,$11,$12,$13) RETURNING "id"
 2044 | 00:02:37.742843 | tac      | INSERT INTO "dashboard" ("ask_difference","bid_difference","coin","ex1","ex1_price","ex1_quote","ex2","ex2_ask_price","ex2_bid_price","ex2_quote","ex2_volume","inserted_at","updated_at") VALUES ($1,$2,$3,$4,$5,$6,$7,$8,$9,$10,$11,$12,$13) RETURNING "id"
 2043 | 00:02:37.744037 | tac      | INSERT INTO "dashboard" ("ask_difference","bid_difference","coin","ex1","ex1_price","ex1_quote","ex2","ex2_ask_price","ex2_bid_price","ex2_quote","ex2_volume","inserted_at","updated_at") VALUES ($1,$2,$3,$4,$5,$6,$7,$8,$9,$10,$11,$12,$13) RETURNING "id"
(15 rows)

insert_all is definitely faster than parallel insert, but that doesn’t explain the overall time.

Were you ever able to get logs from your production phoenix app, ideally with debug level logging turned on?

Then, I will use insert_all. I like insert becase it takes care of timestamps where as in insert_all I will have to include timestamps.

I have the logs but they dont include debug level logging. It only displays what routes were requested and in what time they were served. Would you be kind enough to show me the way to enable debug level logging ?

I restarted the droplet, and CPU load was at <1% and after a few minutes its back at 100%.

What about memory? How’s the memory utilization? Is it swapping? Maybe low memory triggers disk thrashing?

Memory consistently runs at ~50%.