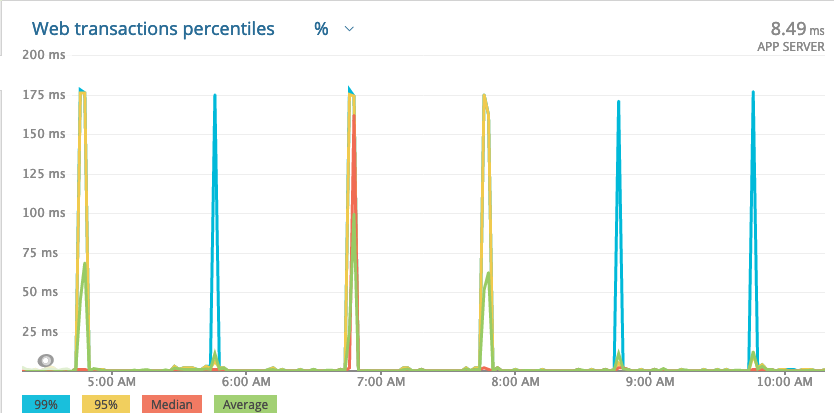
Really loving elixir and beam , the performance is amazing, even the P99 that shoots to 150ms is far acceptable coming from ruby world. But I would like to understand and know how to improve this and help over tuning or links to improve this would be highly appreciated.
Thanks ![]()
Do you know it’s GC or could it be something else? Do you have a database backing it that could cause the delays?
I’m asking because BEAM has per-process GC and most request processes shouldn’t encounter GC at all because they are so short lived. At least that’s my understanding.
You definitely have a 150ms P99 to figure out but, as @Nicd notes, GC is unlikely to be the cause since there is no global stop the world garbage collection on the BEAM. Have you been able to identify any of these long requests in the logs? Are there any commonalities between them? What is this measured from? The load balancer or the application metrics?
I’m not a betting man, but I’d put money on the fact that what you’re seeing is not in any way related to GC (unless you’re using advanced features of OTP 22 like persistent_term incorrectly).
I’d encourage you to actually profile your app with something like xprof: https://github.com/Appliscale/xprof or instrument it with telemetry: https://github.com/beam-telemetry/telemetry. That will actually show you where the time is spent in those very long requests.
Also, I’d say that it’s the database. It’s almost always the database 
Don’t have a DB it only has ets for storing data. The ets is used as a counter as well if anything then could be multiple writes to ets same key i.e increment the counter. but the counter is updated on a separate process and there request is not blocked even for the external call.
its from the application, will add some verbose logging to track it further. thanks
only got ets not database will try out the profilers to see if they help. thanks
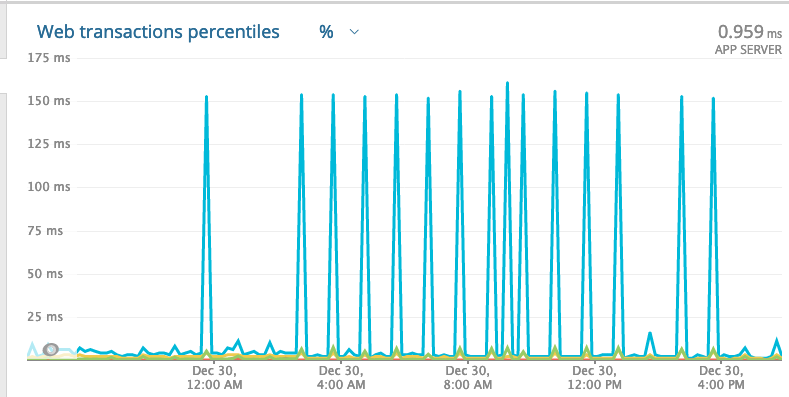
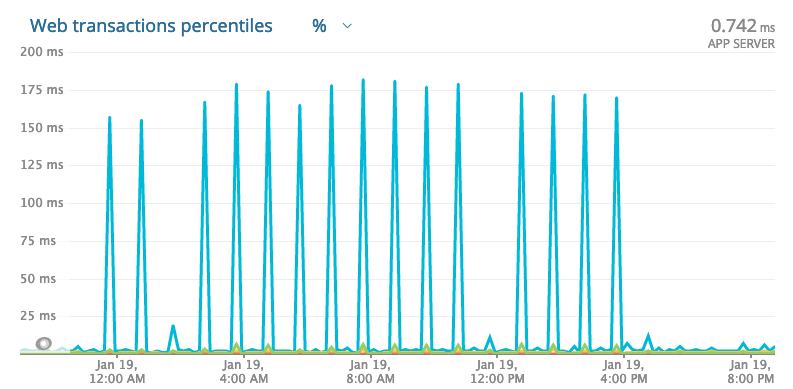
From New Relic its the POST endpoint that is slow at times

Also same can be seen according to application logs.

It could be Jason encoding that could be slow at times
or the SSL connection by Plug.Cowboy
But then again all endpoints use the same SSL and JSON encoding. From the surface looks to be something else effecting P99.
With few exceptions, it looks like the spikes are happening on the hour, every hour. Sometimes they’re small (~10ms), and sometimes they’re bigger (> 150 ms), but there’s almost always a spike. Is there a job that runs hourly in your app, on something that uses your app, or on anything else your app relies on? What does your resource consumption look like before, during, and after the spikes? Does your traffic spike hourly?
If it is something like that (hourly), are you running in AWS or similar? Sometimes those instances have internal cron jobs that run and will cause spikes and then you have to fight with AWS for them to admit there is something that they are running that is causing the issue 
I noticed it run spikes ever 46th minute and its between 12:00am- 4:00pm . I have a task that runs every 15 minutes and takes a snapshot of a very small ets table (only five keys and values that are just counter) so that is very unlikely the issue as it would have happened every 15 mins and would effect all calls rather than just one endpoint. The resource consumption looks quite stable compared to the spike. There are traffic spikes not so much in sync that they happen on the same minute every hour. I am suspecting either it is the websocket connection to slack api or some host process that causes this.
I am running in cloud (Hetzner). I am inclining towards this might be something on the host level that causes this bottleneck. will continue to dig further to see
Judging by the name of the endpoint, does this POST request by any chance send a message to slack synchronously? In that case the P99 is the response time of the slack api
The slack api call to send message is done in a separate process the endpoint returns a response so both aren’t linked.
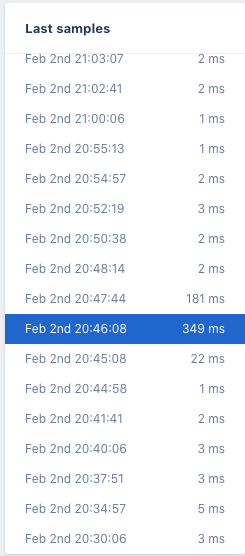
So I manged to drilldown further and seems its not to do with any external service. @AppSignal was instrumental in digging through it. This is happening when a burst of request are received and it seems that scheduling of work could be taking time or response rendering takes it toll.
Could be a Plug performance issue or Jason.encode! issue under load?
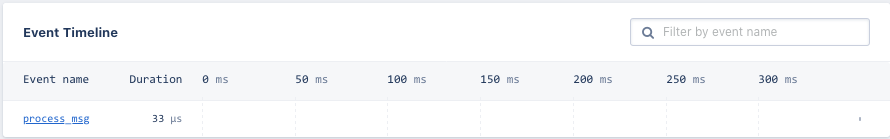
APM from AppSignal
its visible that the call that to set external calls returns in 33us even for the call that got held up for 349ms
BEAM stats from NewRelic

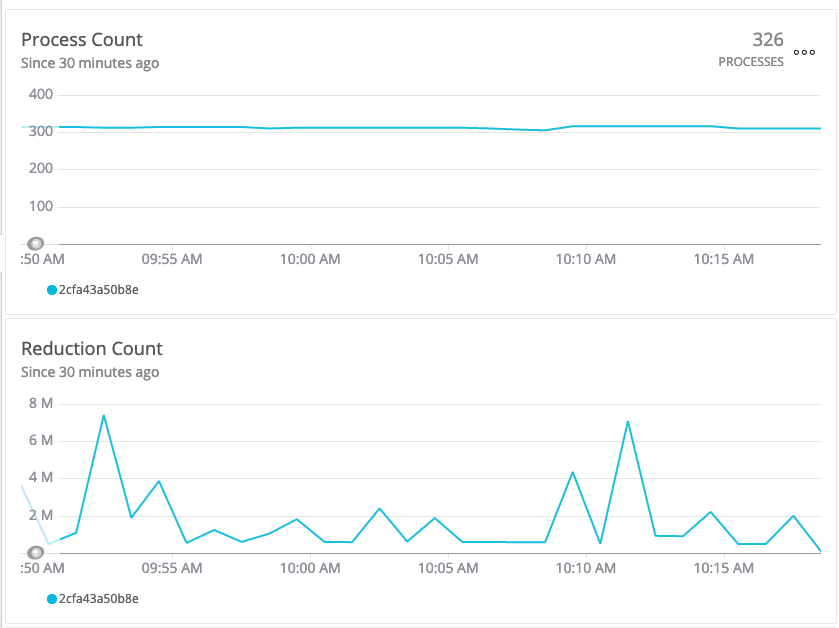
any optimizations for Plug, Jason or BEAM that could help ? I am running this service on a Scaleway D
ev1-S which is a 2 vCPU and 2 GB RAM in a container
Do you know if the body is larger for those slow requests compared to the others?
yes it is at times compared to others. the request that took 349ms its body size was as below
![]()
![]()
and a request that took 919us its body was as below
![]()
![]()
its comparatively a small body under 100KB could the pattern matching be slow for this body size ? what would be the approach then to improve it ?
Maybe you could store those slower bigger responses before it’s JSON encoded and do a benchmark against Jason.encode!? If that ahsandar/ultronex is code that you are using to test this cowboy you seem to be using is 2.6.3, maybe upgrade to latest cowboy 2.7.0 and see if that fixes things?
![]()
Maybe you could try Jason.encode_to_iodata! as well.
From Jason — jason v1.4.1
This function should be preferred to
encode/2, if the generated JSON will be handed over to one of the IO functions or sent over the socket. The Erlang runtime is able to leverage vectorised writes and avoid allocating a continuous buffer for the whole resulting string, lowering memory use and increasing performance.


