Looking for best way to animate a VegaLite chart in Livebook

I am trying to animate VegaLite charts in Livebook. The idea that I am currently working towards is to animate a 2D histogram over time. I have seen some work (external to Elixir) to specify animations in VegaLite, but what I am wanting is to simply create a VegaLite chart every frame, so I am not looking for super high framerates. Livebook to replicate the issues below. (Note that you need to install Node.js and some packages for exporting VegaLite charts. See here.)

Let’s use this code as example:

alias VegaLite, as: Vl

chart = fn ->
  data =
    for month <- ["Jan", "Feb", "Mar", "Apr", "May", "Jun", "Jul", "Aug", "Sep", "Oct", "Nov", "Dec"] do
      for day <- 1..31 do
        %{month: month, day: day, temperature: Enum.random(32..100)}
      end
    end
    |> List.flatten()

  Vl.new(title: "Daily max temperatures")
  |> Vl.data_from_values(data)
  |> Vl.mark(:rect)
  |> Vl.encode_field(:x, "day", type: :ordinal, title: "Day")
  |> Vl.encode_field(:y, "month", type: :ordinal, title: "Month")
  |> Vl.encode_field(:color, "temperature",
    aggregate: :max,
    type: :quantitative,
    legend: [title: nil]
  )
end

Inside a Livebook cell, I can animate it like this:

Stream.interval(500)
|> Stream.take(10)
|> Kino.animate(nil, fn _, _ ->
  display = chart.()
  {:cont, display, nil}
end)

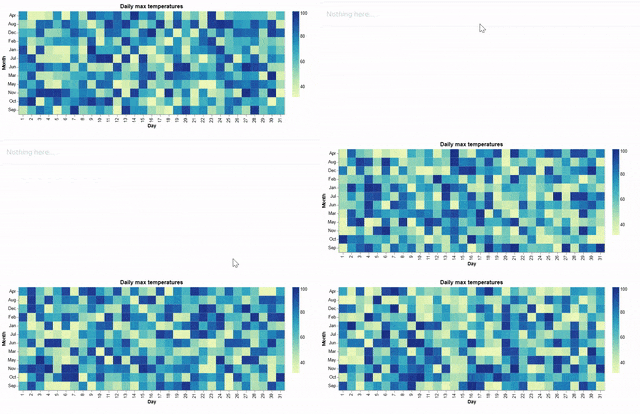
This works and is fast for animation purposes, but this has highly undesirable blinking and flickering since the chart completely disappears between each frame.
animation1

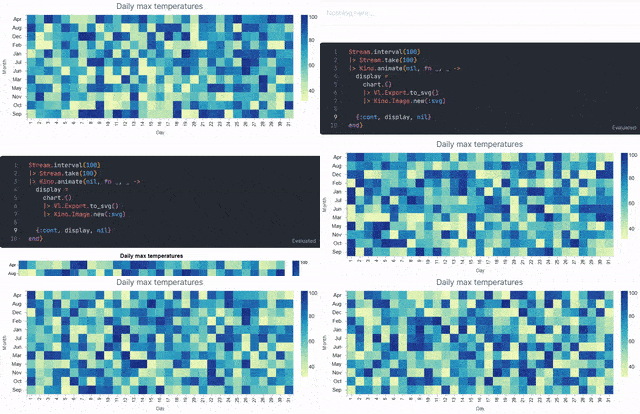
This code exports the chart to SVG and then creates a Kino image:

Stream.interval(100)
|> Stream.take(100)
|> Kino.animate(nil, fn _, _ ->
  display =
    chart.()
    |> Vl.Export.to_svg()
    |> Kino.Image.new(:svg)

  {:cont, display, nil}
end)

This works as desired to create a smooth animation such that between each frame there is no flickering or resetting of the image, but it is extremely slow. VegaLite.Export.to_svg/1 takes over 1.7 seconds on average. Looking at the implementation, it looks like it has a file write, which may be one reason why it is so slow.
animation2

How can I create the behavior of the second example with the speed of the first?

2 Likes

Caveat: as I’m definitely not an expert, there might be a better way to do it. Just got curious reading your question and decided to look into it.

Solution I got to work (You’ll need to add the kino_vega_lite dependency for this):

Chart & Data functions

alias VegaLite, as: Vl

chart = fn ->
  Vl.new(title: "Daily max temperatures")
  |> Vl.mark(:rect)
  |> Vl.encode_field(:x, "day", type: :ordinal, title: "Day")
  |> Vl.encode_field(:y, "month", type: :ordinal, title: "Month")
  |> Vl.encode_field(:color, "temperature",
    aggregate: :max,
    type: :quantitative,
    legend: [title: nil]
  )
end

data = fn ->
  for month <- ["Jan", "Feb", "Mar", "Apr", "May", "Jun", "Jul", "Aug", "Sep", "Oct", "Nov", "Dec"] do
    for day <- 1..31 do
      %{month: month, day: day, temperature: Enum.random(32..100)}
    end
  end
  |> List.flatten()
end

Render & update

update = fn chart ->
  data = data.()
  window = Enum.count(data)
  Kino.VegaLite.push_many(chart, data, window: window)
end

chart = chart.() |> Kino.VegaLite.new() |> Kino.render()

# you could use your approach with `Stream.interval/1` here as well
Kino.VegaLite.periodically(chart, 100, nil, fn _ ->
  update.(chart)
  {:cont, nil}
end)

Basically, chart definition and data generation are split and the data points are pushed to the chart.

As push_many only adds new data points to the chart, we have to make sure that old ones are removed from the dataset - that’s what calculating and setting the :window is supposed to achieve.

5 Likes

Despite your caveat, this works great! I had seen push and push_many, but I had neglected to look into them more, and the :window option works great here. I had to update it a bit for my actual use case, which uses VegaLite.layers to layer multiple histograms. That mainly required just using the :dataset option for Kino.VegaLite.push_many and writing the :name parameter in my datasets (not the top level chart), for example using VegaLite.data(<chart>, name: <name>).

For this new method, I’m not sure how to update any other bits of the chart aside from the data. For example, I’d like to animate the chart title along with the data, maybe displaying the iteration count, or change other pieces of the chart. With Kino.VegaLite.push_many, I think I’m only able to update the actual data, as far as I can tell.

1 Like

Glad it helped take the first hurdle!

Looking a bit more into the kino_vega_lite code, it doesn’t look like updating other fields besides the datasets of the passed VegaLite struct is supported; it’s exported as a spec and passed on to the underlying JS code, which also handles only data updates.

So it’s back to square one as far as re-rendering the charts without the flicker goes. :confused: One (arguably quite inelegant) idea would be to pre-render the next iteration and swap it out with the current, but I’m not sure that’s even possible with Kino.

1 Like

Thanks for taking another look! For now, I am using Kino.animate/3 and returning the iterations for it to render, while the loop calls Kino.VegaLite.push_many/3. Something like this:

    Stream.interval(interval_ms)
    |> Stream.take(iterations)
    |> Kino.animate(environment, fn i, env ->
      update.(chart, env)

      <some stuff>

      if stop do
        :halt
      else
        {:cont, "Iteration: #{i + 1}", tick(env)}
      end
    end)

Here’s a video of the animation I got going:

I feel like the first technique should really be working, since it is supposed to be updating a Kino.Frame (my understanding), but I’m not sure why the frame seems to go away between updates.

However, the technique you provided is at least working for my needs currently. Thank you for your help on this! I’m super happy about this.

2 Likes

Had some time to peruse the vega(-lite) docs and opened a PR that adds some basic support for signals.

Sadly, it seems vega-lite does not support setting the chart title from a signal value, but axis labels and some other properties work.

alias TinyColor.{Conversions, HSL, RGB}
color = fn i -> HSL.new(i, 0.8, 0.7) |> Conversions.to_rgb() |> RGB.to_string() end

chart =
  Vl.new(width: 400, height: 400)
  |> Vl.mark(:line, stroke: [signal: "stroke"], stroke_width: 3)
  |> Vl.param("xTitle", value: "X at iteration 0")
  |> Vl.param("stroke", value: "#000")
  |> Vl.encode_field(:x, "x", type: :quantitative, title: [signal: "xTitle"])
  |> Vl.encode_field(:y, "y", type: :quantitative)
  |> Kino.VegaLite.new()
  |> Kino.render()

for i <- 1..150 do
  point = %{x: i / 10, y: :math.sin(i / 10)}
  Kino.VegaLite.push(chart, point)
  Kino.VegaLite.signal(chart, "xTitle", "X at iteration #{i}")
  Kino.VegaLite.signal(chart, "stroke", color.(i * 2))
  Process.sleep(25);
end

:ok

signals

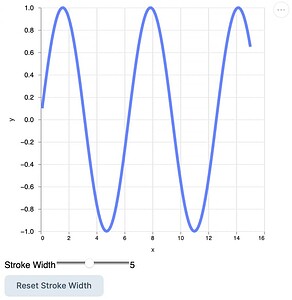
I should also mention that you could use VegaLite.param/3 to bind to input elements; that functionality is built in if you just need controls to modify the chart based on user input.

The proposed Kino.VegaLite.signal/3 function allows updating the values from Elixir code, though. The binding of signal<->control seems to be two-way, so it works as you’d expect.

alias VegaLite, as: Vl

default_stroke_width = 5

chart_spec = fn ->
  Vl.new(width: 400, height: 400)
  |> Vl.param("strokeWidth",
    value: default_stroke_width,
    # bind the signal to a range input, rendered by vega
    bind: [input: "range", min: 1, max: 10, step: 1, name: "Stroke Width"]
  )
  |> Vl.mark(:line, stroke_width: [signal: "strokeWidth"])
  |> Vl.encode_field(:x, "x", type: :quantitative)
  |> Vl.encode_field(:y, "y", type: :quantitative)
end

data = fn ->
  for i <- 1..150, do: %{x: i / 10, y: :math.sin(i / 10)}
end

update = fn chart ->
  data = data.()
  window = Enum.count(data)
  Kino.VegaLite.push_many(chart, data, window: window)
  chart
end

chart = chart_spec.() |> Kino.VegaLite.new() |> update.()
Kino.render(chart)

Kino.Control.button("Reset Stroke Width")
|> Kino.render()
|> Kino.listen(fn _event ->
  Kino.VegaLite.signal(chart, "strokeWidth", default_stroke_width)
end)

2 Likes

The PR was accepted today ( :heart: ) with some changes. signals are an undocumented API in vega-lite at the moment and it’s not clear what future support it will receive, but the params API works quite similar (and is based on signals from what I understand). Here’s a (truncated) example for how to dynamically update properties of a chart:

# create and render a chart
chart = VegaLite.new(width: 400, height: 400)
  # register a parameter
  |> VegaLite.param("stroke_width", value: 3) 
  # reference it as an expression in place of a literal value
  |> VegaLite.mark(:line, stroke_width: [expr: "stroke_width"])   
  # ... encodings (, data) etc.
  |> Kino.VegaLite.new()
  |> Kino.render()

# call set_param/3 to change the value
Kino.VegaLite.set_param(chart, "stroke_width", 10)
1 Like

Sorry for spamming this thread so much, but wanted to leave some additional info for anyone stumbling into [expr: "param_name"] not working for certain chart properties.

You’ll need to consult the vega-lite docs, which properties accept an ExprRef, see for example the title spec. So, a correction for the above: you can dynamically update the chart title by setting it to a param like so:

VegaLite.new(title: [text: [expr: "title_param"]])
|> VegaLite.param("title_param", value: "Default Title")

and updating it later via Kino.VegaLite with

Kino.VegaLite.set_param(chart, "title_param", "Updated Title")

On the other hand, looking at the encoding field definition spec, we see that its title property only accepts Text | Null, which means this will not work:

VegaLite.new(title: "Static Chart Title")
|> VegaLite.param("x_title", value: "Default X-Axis Label")
|> VegaLite.mark(:line)
|> VegaLite.encode_field(:x, "x", type: :quantitative, title: [expr: "x_title"]) # does not accept an 'ExprRef'
|> VegaLite.encode_field(:y, "y", type: :quantitative, title: "Static Y-Axis Label")

Now, as mentioned above, signals are not documented or officially supported by vega-lite (see here and here). That being said… if [expr: "param_name"] does not work, you could try [signal: "param_name"] instead. It does work for the field title, for example:

VegaLite.new(title: "Static Chart Title")
|> VegaLite.param("x_title", value: "Default X-Axis Label")
|> VegaLite.mark(:line)
|> VegaLite.encode_field(:x, "x", type: :quantitative, title: [signal: "x_title"])
|> VegaLite.encode_field(:y, "y", type: :quantitative, title: "Static Y-Axis Label")

Updating it via Kino.VegaLite.set_param/3 works the same.

Just be aware that we’re using a non-public API, strictly speaking.

1 Like