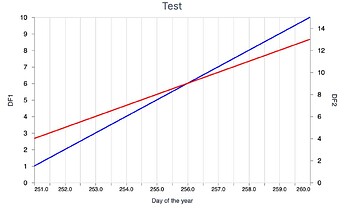
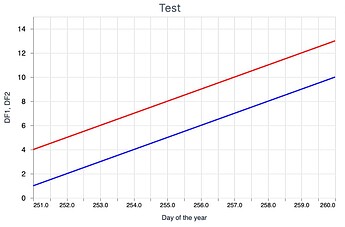
I am searching for version to plot two dataframes with the same colon name into a layer each. I tried it in VegLite Json:
{
  "$schema": "https://vega.github.io/schema/vega-lite/v5.json",
  "data": {
    "values": [
      {"x": 1, "y": 10},
      {"x": 2, "y": 20},
      {"x": 3, "y": 15}
    ],
    "name": "data1"
  },
  "layer": [
    {
      "data": {
        "values": [
          {"x": 2, "y": 30},
          {"x": 3, "y": 25},
          {"x": 4, "y": 35}
        ],
        "name": "data2"
      },
      "mark": "line",
      "encoding": {
        "x": {"field": "x", "type": "quantitative"},
        "y": {"field": "y", "type": "quantitative"},
        "color": {"value": "blue"}
      }
    },
    {
      "data": {"name": "data1"},
      "mark": "line",
      "transform": [
        {"filter": {"field": "x", "range": [2, 3]}}
      ],
      "encoding": {
        "x": {"field": "x", "type": "quantitative"},
        "y": {"field": "y", "type": "quantitative"},
        "color": {"value": "red"}
      }
    }
  ],
  "resolve": {
    "scale": {
      "x": "shared",
      "y": "independent"
    }
  }
}
What I came up with in Elixir draws the seconds DataFrame so that, it is WWWWAY to high over the correct place and the y range is evenly wrongly scaled:
  def create_compare_graph(data_a, data_b, title, col) do
    Vl.new(width: 500, height: 300, title: title)
    |> Vl.data_from_values(data_a,
                          only: ["day", col])
    |> Vl.layers([
      Vl.new()
      |> Vl.mark(:line, color: "blue")
      |> Vl.encode_field(:x, "day",
                         type: :quantitative,
                         title: "Day of the year"
        )
      |> Vl.encode_field(:y, col,
                        type: :quantitative,
                        scale: [domain: [0, 1]],
                        title: "DF1"),
      Vl.new()
      |>Vl.data_from_values(data_b,
                            only: ["day", col])
      |> Vl.mark(:line, color: "red")
      |> Vl.encode_field(:x, "day",
                         type: :quantitative,
                         title: "Day of the year")
      |> Vl.encode_field(:y, party,
                         type: :quantitative,
                         scale: [domain: [0, 1]],
                         title: "DF2")
    ])
    |> Vl.resolve(:scale, y: :independent)
  end
end
Example Data:
DF1:
day value
| 250 | 0.125
| 251 | 0.13
| 252 | 0.13
| 256 | 0.14
| 257 | 0.14
DF2:
day value
| 250 | 0.36
| 251 | 0.36
| 252 | 0.36
| 256 | 0.36
| 257 | 0.36
If possible I would prefer to do it, in Tucan as the code locks much cleaner with it. ![]()


