I’m testing a phoenix application that basically inserts a random number into a :ets table and also a Postgresql database.
I’m getting the below error when I run a benchmark with siege or wrk Postgrex.Protocol (#PID<0.2622.0>) disconnected: ** (DBConnection.ConnectionError) client #PID<0.23411.2> exited(not sure why this error) as well as Connection not available and request was dropped from queue after 131ms. You can configure how long requests wait in the queue using :queue_target and :queue_interval; which I believe is due to the pool size (currently using 30, how can I fine tune this for a site that will receive about 1-2k request per second).
I’ve read a number of post on the beam and memory leakage, is it something I should worry about when dealing with phoenix; at the core is the cowboy server which relies on ranch, it spawn a process for each request; is the process garbage collected once the request is done, can I use sweetxml without anything to worry - read somewhere of a possible memory leak.
Also I plan cleaning the :ets table every 2-5mins as I’m using it to store sessions (no way to store sessions using the built in phoenix session as the request is a ussd request *num#) using either select_delete or match_delete, there’s a field in the tuple that stores timestamp, I intend to delete based on that, which functions is more efficient -select_delete or match_delete.
I plan using either hackney or httpc(does it support http2) as the http client(post some xml and using xpath provided by sweetxml to extract a few values) disabling connection pooling as it won’t be necessary in this instance; anything to note here.
Cowboy spawns a process per request (and 1 additional process per connection). Elixir’s garbage collector is optimized for this type of short-lived process lifecycle. These processes by themselves wouldn’t be prone to a memory leak (nor other processes created by Phoenix & core deps). You can run into memory issues with your own processes, but you can prevent them pretty easily as well. If you have an application that is designed around long-running processes, the easiest approach here would be to set the -env ERL_FULLSWEEP_AFTER flag to a low number like 20, or use process hibernation.
This one is pretty hard to say for sure. Is your database performance acceptable (good indexes, mix of read/write versus pure write)? The top of my head says that 1k rpm / 30 pool size would be acceptable. However, I could easily make a system where this isn’t the case by making the queries slow.
Thanks for the swift response. I was actually testing on a low spec database server. I will move the DB to a 16GB, 8Core CPU, I need to handle about 1-2k request per second(will the poolsize still be enough ) - will let you know how it goes. I checked out mojito and looks cool, still benchmarking though as I need a client that’s very fast. I tried curl on linux, it looks a bit faster than mojito.
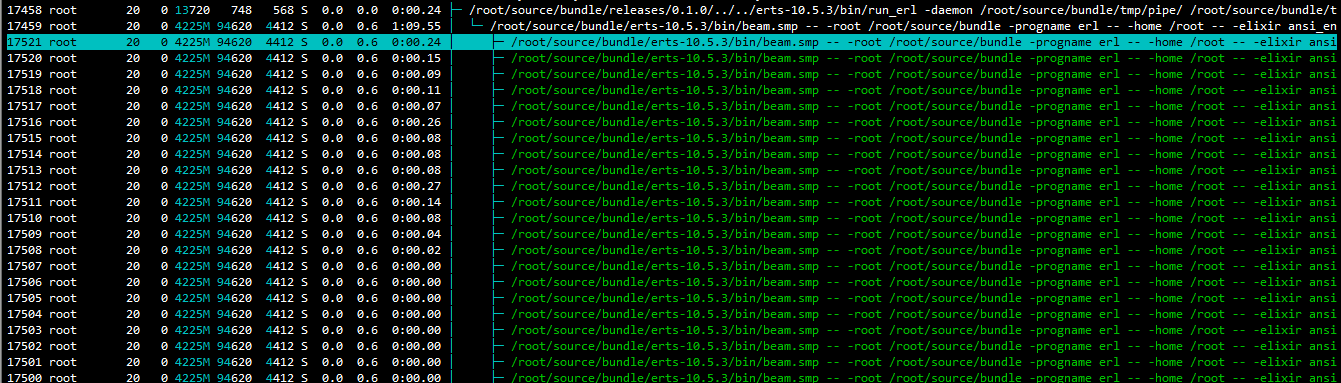
I observed on my production machine(16Core, 16GB RAM) a lot of beam instance about 50, is this normal. The number seems to reduce on my test box, kindly check below and the memory size is almost 100MB.
There’s not really any way to tell. My gut says yes, and I have some applications serving that throughput with a smaller pool size. But it’s not really something that I could tell you with the available info.
How many cores are on the server that’s running the application? I don’t think there’s really any red flags right now. The BEAM does have a particular CPU / memory usage profile that can be different than other platforms, but that doesn’t mean it’s bad.
Most of the operations is around :ets - the DB handles only inserts, creating an index might not be ideal as time will be spent in making an entry in the index table.
There’s not really any way to tell. My gut says yes, and I have some applications serving that throughput with a smaller pool size. But it’s not really something that I could tell you with the available info.
I will play around the poolsize whiles running the benchmark
How many cores are on the server that’s running the application? I don’t think there’s really any red flags right now. The BEAM does have a particular CPU / memory usage profile that can be different than other platforms, but that doesn’t mean it’s bad.
16Cores - I also added the observer_cli - it seems to start a lot of processes when I connect via remote and start the observer, nevertheless it’s a wonderful tool. 100 - 120MB was allocated to the application and actual usage was around 70MB, I was wondering why the beam was not releasing the memory back to the OS(inner workings I guess)
@sb8244 - I’m so grateful for your guidance & your book has been a great friend to me.
Ah, I didn’t realize that reads were coming from ETS. Are you running ETS in concurrent read mode? Do you have any single process bottlenecks?
It’s hard to tell exactly where the bottlenecks you’re seeing are. One thing to do is to enable “sort by reductions” in observer CLI and then look if you have a process getting hit hard.
I am not sure that observer_cli starts a lot of processes, but it’s hard to tell exactly what your’e seeing.
Yes, inner workings. It holds onto some allocated memory so that it can internally allocate it without a system allocation. It’s fairly complex, though.
I’m curious to ask if you are closing your db connection in your script. Because if not, processes will stack up in the background for every opened, and not closed db connection. Also, you should never use root as the user ever in any program deployed to the public.
It looks like that they didn’t make a “Elixir User” and group like they should have when I installed it, but that’s a different issue, but remotely connected because by your screen shot: running the program with root access.
MySQL tends to scale extremely poorly except in the cases where it’s mostly used as a KV store (in those cases why use SQL?). For even moderately sized SQL queries PostgreSQL scales significantly better than MySQL.
One would think that, but that is why I test my deployments with the two engines. But the one folly with Posgres is the connection timeout doesn’t always work, so unused processes start to stack up. It seems it needs the db to be closed in the script code after querying or else excessive memory leaks happens.
As far as the server, I would never recommend putting it on a web page server, or shared web hosting because those container configurations are typically limited to 5% of the system resources per container. This is how host providers like Godaddy divide a server for several web sites. I do provide a higher cpu allocation in my executive package (20% of 24 cores @ 64 GB ram) but the hosting management software limits my maximum allocation for shared hosting to 20% of resources per web container. If your interested in something like that, you can check it out at: https://www.audiospecific.com . I used to lease my servers for streaming, but I decided to allocate some for other web hosting. I have someone working on an Erlang hosting interface so I can offer Elixir hosting. Which makes me wonder what we should call it: Erlang Hosting, Elixir Hosting, or Phoenix Hosting.
Ah, I didn’t realize that reads were coming from ETS. Are you running ETS in concurrent read mode? Do you have any single process bottlenecks?
I checked the observer_cli, no observable bottleneck, ETS is fine, it’s powered by a GenServer but interaction is done directly without going through the GenServer aspect. write & read concurrency are both set, I purge the :ets table after every 3mins using select_delete
I observed a few DB errors, client were timing out on the connection pool. I’m moving the database to dedicated server, I will run another benchmark and update with my findings.
I tried Mojito as suggested and it looks awesome. Currently going through the memory link to learn more. Keep the resources coming, interesting stuff. Thanks once again.
I’m using a connection pooling; basically connections are recycled, something like keepalive. I’m running the app on a test machine with production specs, hence the root account - thanks all the same. It’s an private infrastructure with no direct public access.
Mojito is good for a sealed environment, mainly because Javascript can get flaky on the client side and cross browser compatibility issues that arise from deploying it publicly. I personally think its not good for certain web sites like on line shopping, or social media. But if it doesn’t require high security with a database, its ok.
Mojito is a higher level http client based on Mint . I’m sure we are talking about different things.
Interesting. I wondered why they renamed the Elixir XClient…
Its not a higher level http client. Its one based off of Haskell/binary language instead of the C++, which might have less security issues because it wouldn’t have the same C language exploits.
Yes, I was thinking of the Mojito Framework. I didn’t realize someone re-used the name.
Ecto logs how long the queries are taking. You want to look at two values: query time or queue time. If the query time is high, then it is your queries that are taking long, hence the timeouts. If the queue time is high, then it is that your pool size is low compared to your load. Note increasing the pool size does not necessarily lead to better performance since it leads to a less efficient use of caching.
To be clear for future readers, afaik Mint nor Mojito are based on none of these things.
Ecto logs how long the queries are taking. You want to look at two values: query time or queue time. If the query time is high, then it is your queries that are taking long, hence the timeouts. If the queue time is high, then it is that your pool size is low compared to your load. Note increasing the pool size does not necessarily lead to better performance since it leads to a less efficient use of caching.
I’m currently setting up a postgresql server to run another benchmark; it was a simple insert using Repo.insert_all with request coming in from siege or wrk (between 1-2k request per second)
Another error I observed was Postgrex.Protocol (#PID<___>) disconnected: ** (DBConnection.ConnectionError) client #PID<___> exited - I would be grateful if you could educate on this error. I’ve made a lot of noise about Elixir; I need to get it right - I must admit that I’m a bit nervous.
In context - I know it’s a bad practice; can connection pooling be turned off, there are instances where you have an application that occasionally talks to a db, keeping a pooling around IMHO is not ideal as resources(however small) is required to maintain connection both ways(client & server).
Kudos for the awesome work, I will revert with my findings once the Postgresql DB is setup.