Structuring a LiveView with many similar (dynamic?) components

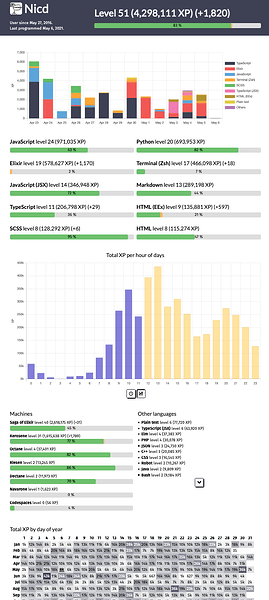
So I have this page and I’m thinking of making a new version of it with LiveView:

As you can see, there are many different graphs on the page. Currently on the frontend I have a JS system where each graph is its own component and defines what kind of data it is interested in. Since many graphs can be interested in the same data (such as the two language lists), I don’t want to duplicate queries.

Additionally, the page is live updated, so all the graphs get the new data and decide what to do with it.

Now I’m wondering how to structure this with LiveView. I just started hammering it directly and got the top bar and top languages list working, but obviously the LV module will become a mess with all the data retrievals. So I want to structure it in a cleaner way. I have some ideas but would be nice to get yours.

A final aim here is that some time in the future, the specific graphs and their positions could be configurable, so if possible, I don’t want to hardcode them in the template. But I don’t know what LV’s change tracking would think of that.

My plan is to do something like this for now (pseudo-ish):

defmodule ProfileLive do
  @graphs [
    TopBarGraph,
    Last2WeeksGraph,
    TopLanguagesGraph,
    ...
  ]

And then somehow render the stuff based on that list (then later it could be made configurable). The modules would have something like

defmodule TopBarGraph do
  def wants_data(), do: MapSet.new([:user, :total_xp, :recent_xp, :date_xps])
  ...
end

and then the LV module would combine the needed datas and retrieve those, providing them to the graphs. Does that sound reasonable?

But if the data needs are dynamic like that, I would need to render the component in a generic way like

<%= live_component(@socket, TopBarGraph, data: @TopBarGraph_data) %>

right? I can think of a couple other ways too, but I’m not sure which of them would work with LV’s change tracking so it doesn’t have to render everything on every update.

I think I can get the live updates working once I figure out a good structure for the basic setup. So, any ideas welcome. :slight_smile: Have you done anything similar?

1 Like

I’ve just been doing something similar, building pluggable charts for borehole data.

What I ended up doing was:

  • Pluggable data extractor modules (basically a “read_data” function in each module that receives a keyword list for context - e.g. dates - in my case a borehole identifier)
  • A small piece of configuration (currently hard-coded, but in future will be user-configurable) that maps named datasets to the data extractor modules
  • On mount or handle_params, I iterate the data extraction configuration to build a map of extracted datasets using the different extractor modules and put them on the socket as socket.assigns.dataset (in my case about 20Mb per liveview process - thankfully there’s only ever a handful of users!). There are also some derived datasets generated from the base ones (e.g. moving averages) - the data extraction process runs the base ones first, then generates the derived ones.

In the case where you are listening for live updates from other parts of the system I would just update the data held in socket.assigns.datasets in the appropriate handle_info

That sorts out the data extraction.

I also have pluggable renderers for each different type of visualisation I want to show (mostly based on Contex FWIW - they emit SVG so no JS hooks are required).

I then have a definition for each display element that defines the named dataset to use, the pluggable rendering module and any settings to control the rendering. This is added to the socket as display_blocks

Finally I have a component that is embedded in the main liveview along the lines of what you have:

<%= live_component(@socket, MyLayoutComponent, datasets: @datasets, display_blocks: @display_blocks, other_stuff: @other_stuff, id: "some-id") %>

MyLayoutComponent handles organising height & width of all the sub-components based on the settings in the passed display_blocks, passing in the correct dataset and settings and invoking the rendering. The whole thing re-renders when anything changes at the moment (data, settings or other things like the currently selected item - aka other_stuff), which is a bit inefficient but actually performs ok. I feel the code and approach is reasonably well organised and easy enough to extend with additional visualisations.

I hope this makes sense!

3 Likes

Thanks! This hints that my original idea would at least work. Shame that you lose the LV change tracking accuracy, though, so willing to hear any other ideas that would allow me to keep it.

1 Like

There’s nothing structural there that makes me lose change-tracking. Just laziness on my part in not wrapping the rendering functions into LiveComponents. As it happens, I now have a glitch in the rendering sequence and some JS interop that is forcing me to do it properly for a couple of them!

1 Like

Have you looked into Surface? :slight_smile:

https://hexdocs.pm/surface/Surface.html
https://surface-ui.org

3 Likes

I have not. Is there anything specific there that would apply to this situation?

I have started building a first iteration of this and will post here how it works when there’s an MVP. :slight_smile:

Disclaimer: I’ve contributed to Surface and built the SurfaceFormatter, so I’m biased. :grin:

Surface provides a somewhat “React-like” syntax for building reusable components. You can define the interface of what data should be passed into the component, with some compile time checks. It’s a more mature development experience for doing components than vanilla LiveView components in my opinion.

1 Like

I hacked on it last week and came up with a first iteration, the meat of it is here: lib/code_stats_web/profile_live · f6ba35970a16f8fff89c0cbc38d80ecce9f53b16 · CodeStats / code-stats · GitLab

There are no docblocks yet and there’s a couple of unused functions laying around, but it’s a start. I’ll describe here how it works so that I can copy these to the docblocks later. :grin:

The building blocks here are Graphs, DataProviders, SharedData, and the live view itself. The relationships are something like:

ProfileLive <--1..n-- Graphs <--1..n-- DataProviders <--1..n-- SharedData

So the live view has many graphs, these are managed by Graphs.Catalogue. The graphs’ responsibility is to receive data and render it, and they are normal live components (not yet sure if they will need to be stateful or stateless). They also have a function render_wrapper that is used to render them into the live view, so that I don’t need to do just data: @data assigns, but I can instead get accurate assigns for each graph. Example from UserInfo:

<%=
  live_component(
    @socket,
    __MODULE__,
    user: assigns[DataProviders.UserInfo],
    total_xp: assigns[DataProviders.TotalXP].total_xp,
    recent_xp: assigns[DataProviders.TotalXP].recent_xp,
    last_day_coded: assigns[DataProviders.LastDayCoded].last_day_coded
  )
%>

I don’t actually know yet how this affects change tracking, because the live updates aren’t implemented, but I’m hoping for the best. And I think it’s nicer that the component only gets the data it needs and not all of it.

Now the graphs in turn have a set of DataProviders that they get data from. The purpose of the providers is to retrieve the initial dataset, and to update it (in the future) when any events come in. Each graph can get data from many providers and the providers can be used for many graphs.

Now, since some providers rely on the same data (like the last 12 hours of events) and I don’t want to repeat the queries, there is finally the SharedData module. Providers specify what shared data they need and SharedData is responsible for requesting it.

Finally we get to combining all of this in the live view:

# Get all the graphs available
graphs = Graphs.Catalogue.graphs()
# Get data providers required by the graphs (now that I think of this, this should take in the graphs as argument)
data_providers = Graphs.Catalogue.data_providers()
# Get the shared data requirements of the providers
required_shared_data = DataProviders.Utils.required_shared_data(data_providers)
# Retrieve the shared data
shared_data = DataProviders.SharedData.get_data(required_shared_data, user)
# Retrieve the initial data to show in the graphs based on the shared data
initial_data = Graphs.Catalogue.get_initial_data(shared_data, data_providers, user)
# Given the graphs, providers, and initial data, build the socket assigns using the module names as keys
socket = Graphs.Catalogue.assign_datas(socket, graphs, data_providers, initial_data)

Then in the template, I use

<%= Graphs.Catalogue.render_graphs(assigns) %>

which in turn is just a for statement that calls the render_wrapper of all the graphs.

Now, this all works great currently, but I don’t have the live updates implemented yet, so it’s not a full featured prototype. Additionally, I have a couple of open questions still:

  • Currently, like shown above, I don’t use render but instead just call the functions directly. I wonder if this affects LV’s change tracking ability? I don’t see any other reason to use render because it would require a view and extra hassle.
  • I have functions that look like this:
    def render_graphs(assigns) do
      ~L"""
      <%= for graph <- @graphs do %>
        <%= graph.render_wrapper(assigns) %>
      <% end %>
      """
    end
    
    and I wonder if the ~L wrapping is necessary or if I could just run the code directly.

I know that’s a lot to read and I don’t expect anyone to invest too much time into this, but if you have any comments or ideas or insults, I’d be glad to hear them. :slight_smile:

2 Likes

Looks like I lose change tracking with this method. I guess it’s because I just call a function with <%= Graphs.Catalogue.render_graphs(assigns) %> and then the function looks like this:

def render_graphs(assigns) do
  ~L"""
  <%= for graph <- @graphs do %>
    <%= graph.render_wrapper(assigns) %>
  <% end %>
  """
end

Is that it? How could I keep change tracking with this structure?

EDIT: José mentioned this should be fine, so I guess there’s just something I don’t understand about LV. I will study more myself before making any more posts. :slight_smile:

I have found Surface to be a very nice solution for liveview, it allows you to build “components” which are easily composable and the end result feels very much like writing HTML, only with magic tags which explode into whole liveview components. Very nice.

I think this git repo might be a great example of what you are trying to develop. I found it useful both for it’s content and for ideas on using LiveView. Shout out to the author!

2 Likes

Hey, thanks for the recommendation.

I quickly looked at the repository and it seems the components are still hardcoded in the live layout (for example DashboardLive). I.e. the component tags are written out in the template so their order is not easy to control. I wanted to be able to not specify the graph components in the template if possible, so that I can configure them per-user. I know I can use CSS Grid for positioning out of order on the screen, but I’d like to try if I can do it generically in LV.

I will come back to this thread when I have something working. :slight_smile:

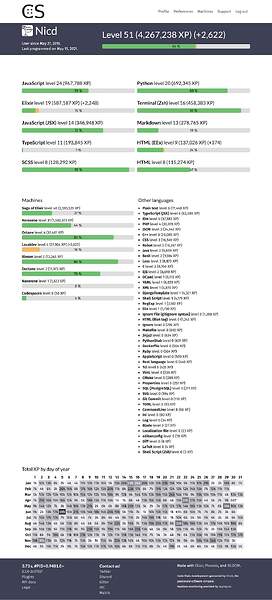
I’ve continued implementing the profile page with LV and I’m currently this far:

As you can see, all the graphs are done except for those that were made with Chart.js in the existing frontend. I will see about converting them to Contex.

The setup is the same as I described earlier, with Graphs, DataProviders, and SharedData, but some details have evolved a bit. Turns out I don’t lose change tracking if I convert all of my child components to live components and I can still use my renderer tricks in Graphs.Catalogue and the graph modules themselves.

Currently my live update size is around 5 KB for any change. That’s a lot of data so I will see about how to minimize it but it’s a lot better than the 60 KB of the initial implementation. Biggest change was adding id tags in all the lists.

With the UserInfo graph, for some reason it always updates all the data even though the only changed data is in the numbers. The username or avatar can’t change, but they are always re-rendered. Don’t know why that is, let me know if you have any ideas.

All in all it’s going quite well. :slight_smile: Looking into Contex next.

Oh, and the code is still here: lib/code_stats_web/profile_live · wip/live-view · CodeStats / code-stats · GitLab

1 Like

Thanks for the update!

Re: Contex - there are quite a few unreleased goodies at the moment. If you need them, point your deps to github for now (updates are in changelog).

1 Like

The code has evolved and I’ve gotten the update diff pushed down. The most impactful thing there were to use stateful components instead of stateless. I had understood wrong the readme note about stateless components always rendering, and it ended up sending all the components as diffs with every small update. I gave the components id arguments and the diff is instantly much smaller.

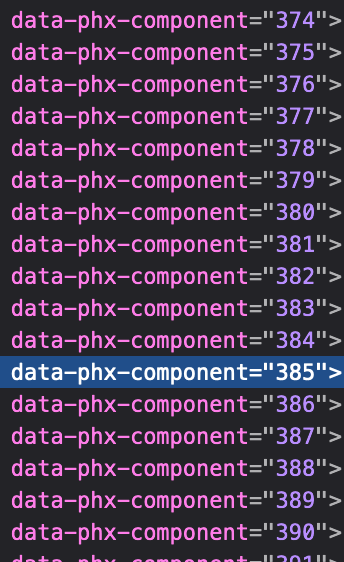
The diff is currently around 3.5 KB. But mostly it’s full of numbers going into data-phx-component attributes, like this:

Screenshot 2021-06-24 at 23.42.01

I don’t know what to do about that. But ContEx is next!

2 Likes

Yeah, I’ve found it perplexing that LiveView sends the entire diff of dynamic bits down every time an event happens. Feels like it has the capacity to eat up a good bit more bandwidth than a SPA. But I haven’t benchmarked.