
axelson
ElixirConf US 2018 – You Can Never Debug the Code You Run, But You Can View the Code the Debugger is Running – Luke Imhoff (@KronicDeth)
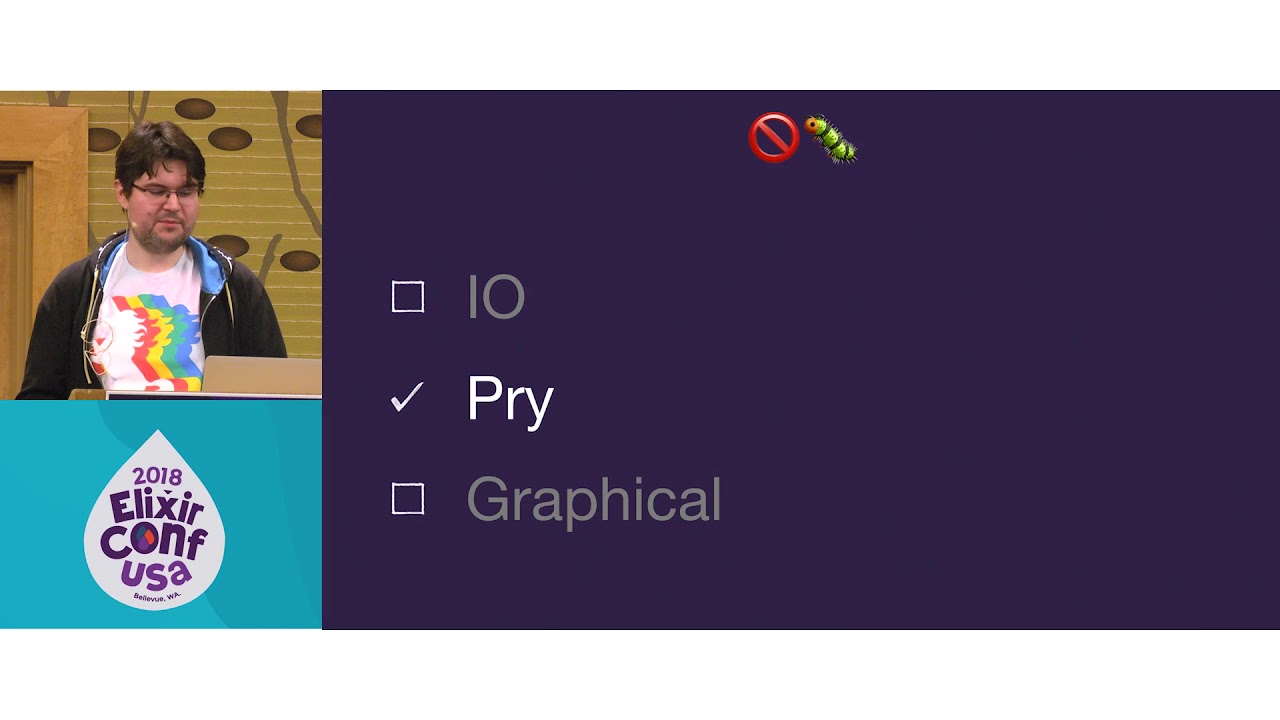
Elixir supports various ways to debug code: printing with
IO.inspect, prying withIEx.pry, or using more advanced OTP tools like:debuggerand:int. Choosing when to use these different tools can be confusing, and understanding how they work can prove downright intimidating.Throughout this talk we’ll peel back the covers on the more advanced debugging techniques and dissect exactly how each debugging tool can be used to examine our compiled code. None of debugging techniques leave your code the same as how it was running in production. Adding
IOandIEx.prycalls obviously changes the code as you edit the source, but using the OTP debugger, either with:debugger, IntelliJ Elixir, or Elixir Language Server, or by adding newbreakpoints from theIEx.pryshell changes the module code being run.Luke Imhoff will show how each type of debugging changes the code by revealing how
IEx.pryand:debuggerare implemented. You’ll see why sometimes the debuggers can’t reproduce bugs because the modifications to make the code debuggable also subtly changes the execution of the code by looking at changes to the bytecode and AST. Although the modified code never exists as source, we can recover the Abstract Syntax Tree (AST) of either the Elixir quoted form or the Erlang Abstract Code from the Dbgi chunk, but the Dbgi chunk ASTs aren’t terribly easy to read, so we can use tools to decompile the code and translate it to Elixir or Erlang modules.When looking at Dgbi code isn’t enough, we can drop down to the Code chunk and look at the bytecode. The bytecode is a unique binary format, so once again we reach for for tools to render it, so instead of having to read machine code, we can read assembly. Looking at this bytecode also allows us to check if our high-level optimizations, such as module attribute reuse, compute variables once, and the order of pattern matching, have an impact on the code run by the VM, as unlike Dbgi, the Code chunk is actually loaded by the VM when running code without debugging.
Audience: Intermediate, Advanced
Topics: elixir, debugging
All talks are available in the ElixirConf US 2018 Talks List or via the elixirconf2018 tag
Where Next?

Trending in Talks
Other Trending Topics


Latest on Elixir Forum
Sponsor Spotlight

Supporting innovation across the BEAM ecosystem.
Categories:
Sub Categories:
Forums
Popular Tags
- #ecto
- #liveview
- #troubleshooting
- #learning-elixir
- #library
- #deployment
- #erlang
- #testing
- #genserver
- #mix
- #absinthe
- #remote-other
- #otp
- #plug
- #how-to-question
- #macros
- #postgres
- #elixirconf
- #channels
- #exunit
- #discussion
- #code-sync
- #podcasts
- #javascript
- #onsite
- #dialyzer
- #docker
- #authentication
- #ai
- #umbrella
- #full-time-contract
- #podcasts-by-brainlid
- #blog-post
- #ecto-query
- #elixirconf-us
- #elixir-ls
- #phoenix_html
- #iex
- #graphql
- #genstage
- #websockets
- #supervisor
- #advent-of-code
- #distillery
- #processes
- #elixirconf-eu
- #api
- #forms
- #security
- #hex
Our Sponsors

Build Elixir applications with speed and confidence.
Supporting innovation across the BEAM ecosystem.

We build reliable cloud platforms for business-critical systems.

Catch errors, track performance, monitor hosts and more.

Error tracking, logs, uptime, and Just Enough APM. Built for developers.

Practical resources that improve the lives of professional developers.

Master modern tools, write cleaner code, and tackle real-world challenges.

The deployment platform built for Elixir: PaaS ease, VPS control.

The team behind Membrane, Popcorn, LiveDebugger. Available for hire.

Courses that'll move you from confusion to "Aha, now I get it!"
Showing Posts 1 to 2- Show Best Posts
- Show All (oldest first)
- Show All (newest first)
blatyo
I’m always impressed with the things he’s able to do in IntelliJ. I really enjoyed the deep dive on how the debuggers work and the BEAM bytecode.
axelson
I really enjoyed this video. It was great to learn more about BEAM internals. I think I need to re-watch the video after reading the BEAM book or the BEAM wisdoms site: http://beam-wisdoms.clau.se/en/latest/